
In this article, Kristina Robertson highlights ELL instructional strategies based on key reading components and skills. In addition, educators will learn more about the role of students' home language and oral language.
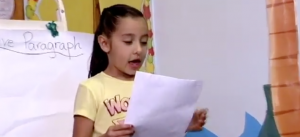
Albuquerque teacher Ali Nava walks her students through a cooperative paragraph summarizing the beginning, middle, and end of Burro's Tortillas and uses the exercise as an opportunity to practice their writing skills.
Graphs, charts, tables, infographics, and timelines are graphics that represent numerical information such as statistics, percentages, and dates.